
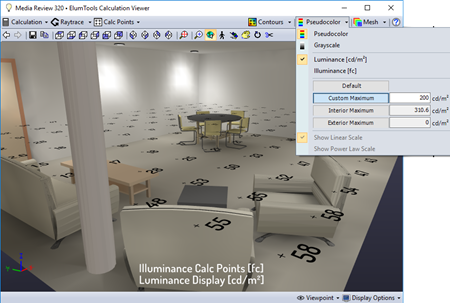
Luminance display with Custom Maximum applied
Selecting the Luminance button will calibrate the visualization for luminance (reflected light) in cd/m2. The Default setting calibrates (exposes) the rendered appearance such that the average scene luminance is assigned to an 18% reflectance gray and the visualization is scaled linearly from there.
Alternatively, the white point of the display can be set to a "Custom Maximum" or to the calculated "Interior Maximum" value entered. In this case the display is scaled linearly downward.
You may need to adjust the Exposure to make the visualization look more realistic (i.e. the average reflectance of the scene is higher or lower than 18%).
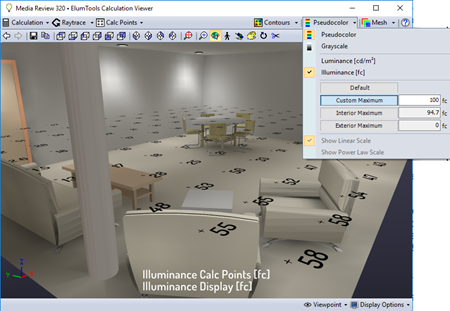
Illuminance display with Custom Maximum applied
Selecting the Illuminance button calibrates the visualization for illuminance (incident light) in footcandles or lux. In RGB mode colors will appear unnatural and dark surfaces artificially bright. The best use for the Illuminance mode is in partnership with Pseudocolor mode (see below).
If the set "Custom Maximum" property is enabled, the white point of the display will be set to the maximum illuminance value. Similarly, the "Interior Maximum" button will set the white point to the maximum calculated interior value*. If no Maximum is selected, the average surface illuminance is used to calibrate the display.
* The maximum calculated illuminance is not the maximum calculation point, but rather the maximum luminous exitance in the scene, converted to illuminance (incident light).
Pseudocolor
or Grayscale
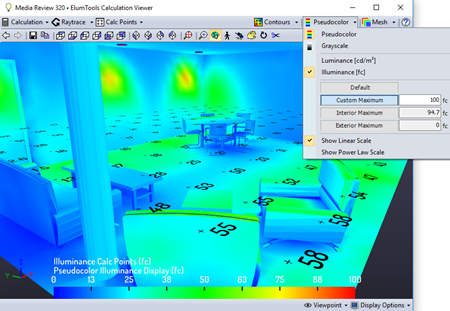
Pseudocolor view of Illuminance with linear scale
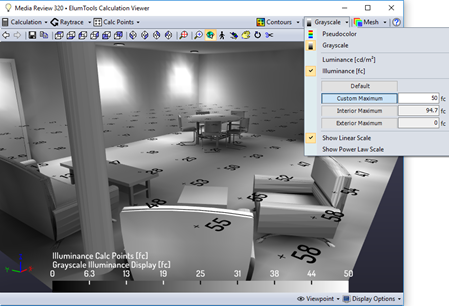
Grayscale view of Illuminance with linear scale
Pseudocolor is a remarkably effective method for interpreting the quantity of light incident on any surface (illuminance) or reflected from any surface (luminance). The maximum value for the color scale is red, corresponding to the highest light level, while the lowest value is deep blue. The maximum value can be set using the Custom Maximum control under both the Illuminance and Luminance button menus. Similar to the standard RGB display, Pseudocolor can be toggled between Luminance and Illuminance by simply clicking the appropriate button on the toolbar.
The Grayscale display works in the same way as Pseudocolor and is simply a monochromatic view of absolute luminance or illuminance.
The Pseudocolor or Grayscale display can be scaled linearly or logarithmically. The Power Law option is useful when attempting to "stretch out" the lower light ranges.
The Pseudocolor button will toggle the currently selected mode (Pseudocolor or Grayscale) on and off, with standard RGB being the default display mode. The previously used setting is always retained.
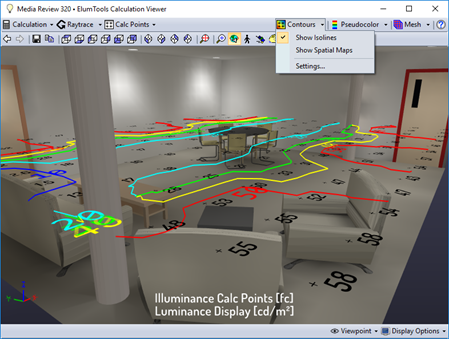
Isolines enabled
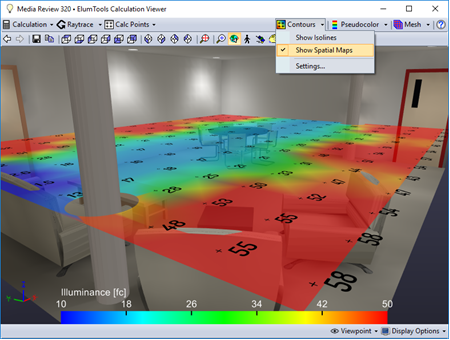
Spatial Maps enabled
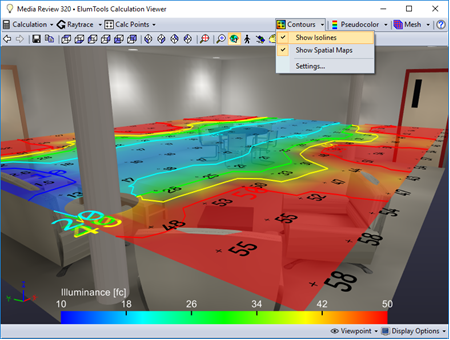
Isolines and Spatial Maps enabled
The Contours button provides access to the Isolines and Spatial Maps features.
Isolines are contour lines of equal value. For example: an Isoline with a value of 20 fc will be a contour line flowing through all calculated illuminance values of 20 fc. Isolines interpolate between calculated values. Therefore, the more dense the calculated grid points are, the more refined the isolines will be. Isolines will not work for line-based points.
Spatial Maps are partially transparent color shaded representations of the calculated values. Both Spatial Maps and Isolines can be enabled for a composite view.
The Settings command from the Contours menu allows you to chose between several intelligent selections for appropriate values for both Isolines and Spatial Maps. You can define your own values and colors if preferred.
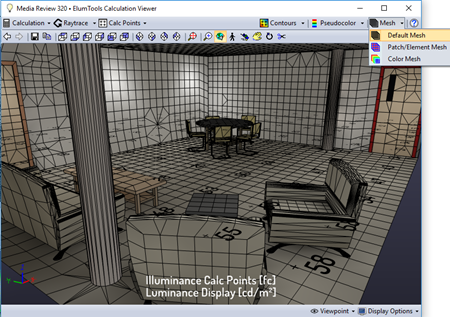
Default Mesh
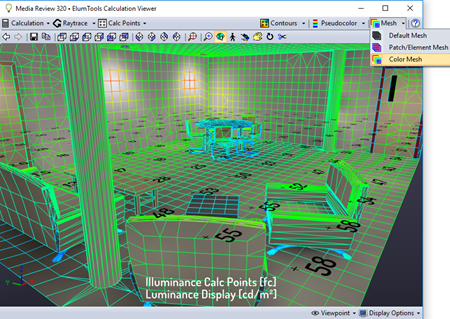
Color Mesh
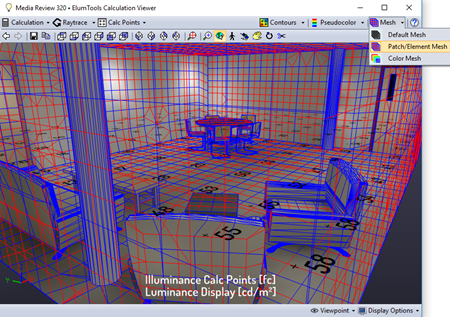
Patch Element Mesh
The Default and Color Mesh options in the Mesh Overlay command superimpose the radiosity element (receiver) mesh over the current view (see Appendix A - Calculation Methodology). The element mesh shows how each surface is subdivided to account for changes in luminance. The Color Mesh provides the option to see the scaled Pseudocolor hues in element mesh, which can be informative when observing luminance or illuminance gradients.
The Patch/Element option shows both elements (receivers) and Patches (emitters) for the environment. Elements are shown in red while Patches are shown in blue. Intelligent inspection of the Patch/Element mesh can be very informative when evaluating the mesh density for calculation rigor.
The Mesh Overlay command will remember its last setting, so that the selected mesh type can be toggled on and off without having to select a mesh preference.